Microservices observability: traces, metrics, and logs without chaos
Master microservices observability with traces, metrics, and logs. Unlock performance and reliability for your B2B software.

The shift to microservices architecture has revolutionized software development, offering unparalleled agility, scalability, and resilience. However, this distributed complexity introduces a significant challenge: understanding what’s happening under the hood. Without robust microservices observability, your product leaders, CTOs, and technology teams are navigating a black box, leading to prolonged debugging cycles, missed performance optimizations, and ultimately, a degraded user experience.
This article dives deep into the core pillars of microservices observability – traces, metrics, and logs – and how to harness them effectively. We’ll explore how to move beyond reactive firefighting to proactive performance management, ensuring your microservices ecosystem thrives.
The Imperative of Microservices Observability
In a monolithic application, troubleshooting often meant examining a single codebase. With microservices, a single user request can traverse dozens, even hundreds, of independent services. Each service has its own logs, its own potential failure points, and its own performance characteristics. This distributed nature, while beneficial for development velocity, creates an intricate web that’s incredibly difficult to untangle without the right tools and strategies.
Microservices observability is the practice of instrumenting your distributed systems to gain deep insights into their behavior. It’s about answering critical questions like:
- Where is the performance bottleneck in this transaction?
- Which service is experiencing an unusually high error rate?
- What is the user experience impact of a specific service degradation?
- Are we meeting our Service Level Objectives (SLOs)?
Without this visibility, teams often resort to guesswork, leading to inefficient resource allocation and missed opportunities for improvement. The cost of poor observability can be substantial, impacting revenue, customer satisfaction, and developer productivity. For B2B software companies, where reliability and performance are paramount for client trust, the stakes are even higher.
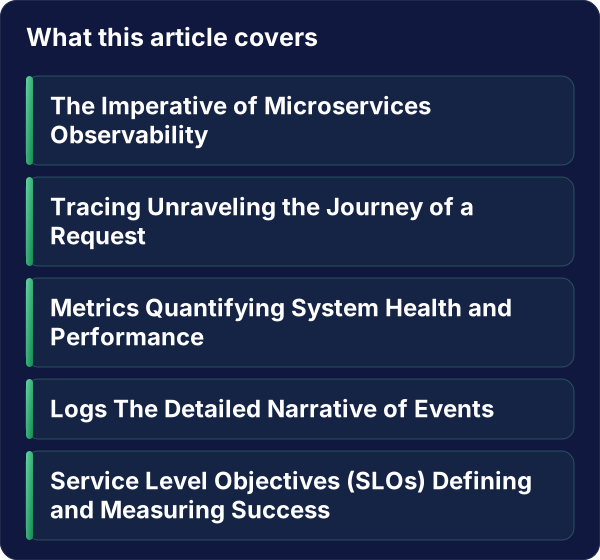
Tracing: Unraveling the Journey of a Request
Distributed tracing is the cornerstone of understanding the flow of requests across your microservices. It allows you to visualize the entire lifecycle of a request as it moves from one service to another, capturing timing information and dependencies.
What is Distributed Tracing?
Imagine a single customer interaction – perhaps a user adding an item to their cart on an e-commerce platform. This seemingly simple action might trigger calls to:
- Frontend Service: Receives the initial request.
- Authentication Service: Verifies user credentials.
- Product Catalog Service: Fetches item details.
- Inventory Service: Checks stock availability.
- Cart Service: Updates the user’s cart.
- Order Service: Initiates the checkout process (if applicable).
Distributed tracing captures each of these interactions as a “trace,” which is composed of “spans.” A span represents a single operation within a service (e.g., a database query, an API call). By linking these spans together, you can reconstruct the entire path of the request, identifying latency at each hop.
Key Benefits of Tracing for Microservices:
- Root Cause Analysis: Quickly pinpoint which service is causing delays or errors in a transaction. This dramatically reduces Mean Time To Resolution (MTTR).
- Performance Bottleneck Identification: Visualize latency across services to identify slow components and optimize them.
- Dependency Mapping: Understand the intricate relationships between your services, crucial for impact analysis during deployments or incidents.
- Service Health Monitoring: Track the latency and error rates of individual service calls.
Implementing Tracing with OpenTelemetry
The de facto standard for instrumenting distributed systems is OpenTelemetry. It provides a vendor-neutral set of APIs, SDKs, and tools for generating, collecting, and exporting telemetry data (traces, metrics, and logs).
- Instrumentation: Developers instrument their code using OpenTelemetry SDKs, which automatically generate trace data for outgoing and incoming requests.
- Collection: An OpenTelemetry Collector can receive, process, and export this data to various backends.
- Export: Traces are exported to a tracing backend (e.g., Jaeger, Zipkin, or a commercial observability platform) for visualization and analysis.
By adopting OpenTelemetry, you ensure your tracing strategy is future-proof and interoperable with a wide range of tools.
Metrics: Quantifying System Health and Performance
While traces show the “what” and “where” of a request’s journey, metrics provide the “how much” and “how often.” Metrics are numerical measurements of system behavior over time, offering a quantitative view of your microservices’ health and performance.
Types of Essential Metrics for Microservices:
- Request Rate (Throughput): The number of requests a service handles per unit of time (e.g., requests per second). A sudden drop might indicate an upstream issue or a service outage.
- Error Rate: The percentage of requests that result in an error. This is a critical KPI for service reliability. A rising error rate is an immediate red flag.
- Latency (Response Time): The time it takes for a service to respond to a request. Tracking average, median, and percentile latencies (e.g., p95, p99) is crucial for understanding user experience. High p99 latency means even a small percentage of users are experiencing very slow responses.
- Saturation: How “full” a service is. This could relate to CPU utilization, memory usage, queue depth, or thread pool usage. High saturation often precedes performance degradation or failures.
- Availability: The percentage of time a service is operational and accessible. This is a fundamental SLO metric.
Leveraging Metrics for Proactive Management:
- Alerting: Set up alerts based on metric thresholds (e.g., error rate exceeding 1%, latency p95 above 500ms). This allows teams to be notified before users are significantly impacted.
- Capacity Planning: Analyze historical metric trends to forecast future resource needs and prevent performance issues due to under-provisioning.
- Performance Optimization: Identify services with consistently high latency or error rates and prioritize them for optimization efforts.
- Business Impact Analysis: Correlate technical metrics with business KPIs. For example, a spike in checkout service latency might directly correlate with a drop in conversion rates.
Metrics and OpenTelemetry
OpenTelemetry also excels at collecting metrics. Applications can be instrumented to emit standard metrics (e.g., Prometheus-compatible exposition format) which are then scraped by a metrics collection system. This unified approach to telemetry simplifies your observability stack.
Logs: The Detailed Narrative of Events
Logs are the raw, timestamped records of events occurring within your services. While traces provide a high-level view and metrics offer quantitative summaries, logs offer the granular details needed for deep dives into specific incidents or behaviors.
The Role of Logs in Microservices Observability:
- Debugging Specific Errors: When a trace points to a problematic service, logs provide the detailed error messages, stack traces, and contextual information to understand why the error occurred.
- Auditing and Compliance: Logs can serve as an audit trail, recording who did what and when, which is vital for security and compliance.
- Understanding Application Logic: Detailed application logs can help developers understand the execution flow and state of a service at a specific point in time.
- Detecting Rare Events: While metrics summarize, logs capture every instance of an event, allowing for the detection of infrequent but critical issues.
Challenges and Best Practices for Microservices Logging:
- Log Volume: Microservices generate an enormous volume of logs. Ineffective log management can lead to overwhelming data and high storage costs.
- Correlation: Without proper context, logs from different services can be difficult to correlate.
- Structured Logging: Instead of plain text, use structured logging (e.g., JSON format). This makes logs machine-readable, enabling easier parsing, filtering, and analysis. Include essential fields like
trace_id,span_id,service_name,user_id, andrequest_id. - Centralized Logging: Ship all logs from all services to a centralized logging platform (e.g., Elasticsearch, Splunk, Datadog). This provides a single pane of glass for log analysis.
- Log Retention Policies: Define clear policies for how long logs are retained to manage storage costs and comply with regulations.
Integrating Logs with Traces and Metrics
The true power of microservices observability is realized when traces, metrics, and logs are integrated. A common pattern is to include trace_id and span_id in your structured logs. This allows you to:
- Identify an error in a metric dashboard.
- Jump to the corresponding trace in your tracing system.
- From the trace, click on a specific span to view all associated logs for that operation.
This seamless transition from high-level overview to granular detail is what enables rapid problem-solving.
Service Level Objectives (SLOs): Defining and Measuring Success
Beyond simply monitoring, effective microservices observability involves defining what “good” looks like. This is where Service Level Objectives (SLOs) come into play. SLOs are specific, measurable targets for the performance and reliability of your services.
What are SLOs?
SLOs are not just vague promises; they are quantifiable commitments. For example:
- Availability SLO: “The checkout service will be available 99.95% of the time over a rolling 30-day period.”
- Latency SLO: “95% of user login requests will be processed within 200ms over a rolling 7-day period.”
- Error Rate SLO: “The API gateway will return an error rate of less than 0.1% for all successful requests over a rolling 24-hour period.”
Why SLOs are Crucial for Microservices:
- Objective Performance Measurement: They provide a clear, data-driven way to assess whether your services are meeting user expectations.
- Prioritization: When an SLO is at risk or breached, it signals an urgent need for attention and resource allocation.
- Team Alignment: SLOs align engineering, product, and business teams around shared goals for reliability and performance.
- Error Budgets: SLOs enable the concept of “error budgets.” If a service is performing well and meeting its SLOs, the team has an “error budget” that can be used for riskier deployments or feature development. When the budget is depleted, the focus shifts entirely to reliability.
Implementing SLOs with Observability Data
Your observability stack (traces, metrics, logs) is the engine that drives SLO measurement.
- Metrics are key: Availability, latency, and error rates are directly measured using metrics.
- Traces provide context: If an SLO is breached, traces help understand why by showing the request flow and identifying failing components.
- Logs offer root cause: Detailed logs associated with a trace can reveal the precise error leading to an SLO violation.
By continuously monitoring your services against defined SLOs, you shift from a reactive to a proactive stance, ensuring your microservices architecture consistently delivers value.
A Practical Checklist for Microservices Observability
Implementing a comprehensive microservices observability strategy can seem daunting. Here’s a checklist to guide your efforts:
1. Define Your Observability Goals
- What are the most critical user journeys?
- What are the key performance indicators (KPIs) for your business and services?
- What are the acceptable latency and error rates for your services?
2. Instrument Your Services
- Adopt OpenTelemetry: Standardize on OpenTelemetry for traces, metrics, and logs.
- Automate Instrumentation: Leverage auto-instrumentation where possible for common frameworks and libraries.
- Manual Instrumentation: For critical business logic or custom operations, implement manual instrumentation.
- Ensure Consistent Context Propagation: Crucially, ensure
trace_idandspan_idare propagated across service calls.
3. Implement Structured Logging
- Standardize Log Format: Use JSON or a similar structured format.
- Include Essential Fields:
trace_id,span_id,service_name,request_id,user_id,timestamp,level. - Log Meaningful Information: Avoid excessive verbosity but capture enough context for debugging.
4. Establish a Centralized Telemetry Pipeline
- OpenTelemetry Collector: Deploy an OpenTelemetry Collector to receive, process, and export telemetry data.
- Choose Your Backends: Select appropriate backends for traces (e.g., Jaeger, commercial APM), metrics (e.g., Prometheus, Grafana), and logs (e.g., Elasticsearch, Loki).
- Data Retention Policies: Define how long data is stored for each telemetry type.
5. Define and Monitor SLOs
- Identify Critical Services: Start with your most important services.
- Set Realistic SLOs: Based on user expectations and business needs.
- Automate SLO Measurement: Use your observability data to track SLO compliance.
- Establish Alerting: Configure alerts for SLO breaches or imminent breaches.
6. Visualize and Analyze
- Dashboards: Create dashboards for key metrics, service health, and SLO status.
- Trace Visualization: Utilize tracing UIs to explore request flows and identify bottlenecks.
- Log Exploration: Implement powerful search and filtering capabilities for your centralized logs.
7. Iterate and Refine
- Regular Reviews: Periodically review your observability strategy, toolchain, and SLOs.
- Feedback Loops: Gather feedback from development, operations, and product teams.
- Continuous Improvement: Adapt your approach as your microservices architecture evolves.
Conclusion: From Complexity to Clarity with Alken
Navigating the complexities of microservices without robust microservices observability is like sailing without a compass. Traces, metrics, and logs are your essential navigational tools, providing the visibility needed to steer your applications towards success. By adopting a systematic approach, leveraging standards like OpenTelemetry, and defining clear objectives with SLOs, you can transform potential chaos into clarity.
At Alken, we understand the unique challenges B2B software companies face in managing distributed systems. Our expertise in building and optimizing microservices architectures, coupled with our deep knowledge of observability best practices, empowers product leaders, CTOs, and technology teams to achieve unparalleled system performance, reliability, and efficiency. We help you instrument your services, set up effective telemetry pipelines, define and track SLOs, and build dashboards that provide actionable insights.
Don’t let the complexity of microservices hold you back. Unlock the full potential of your distributed systems and ensure your users experience the reliability and performance they expect.
Ready to transform your microservices observability? Contact us today to discuss how Alken can help you gain the clarity you need.
Email: info@alken.dev